
At JPool, our mission is to make staking on Solana transparent, decentralized, and rewarding for everyone — from first-time delegators to power users. With our latest redesign, we’ve transformed the Direct Staking experience, revamped the Validator Dashboard for unprecedented visibility, and highlighted a Validator Profit Calculator for instant, crystal-clear projections of potential validator returns.
Whether you’re choosing a validator or analyzing your own node’s performance, everything you need is now at your fingertips.
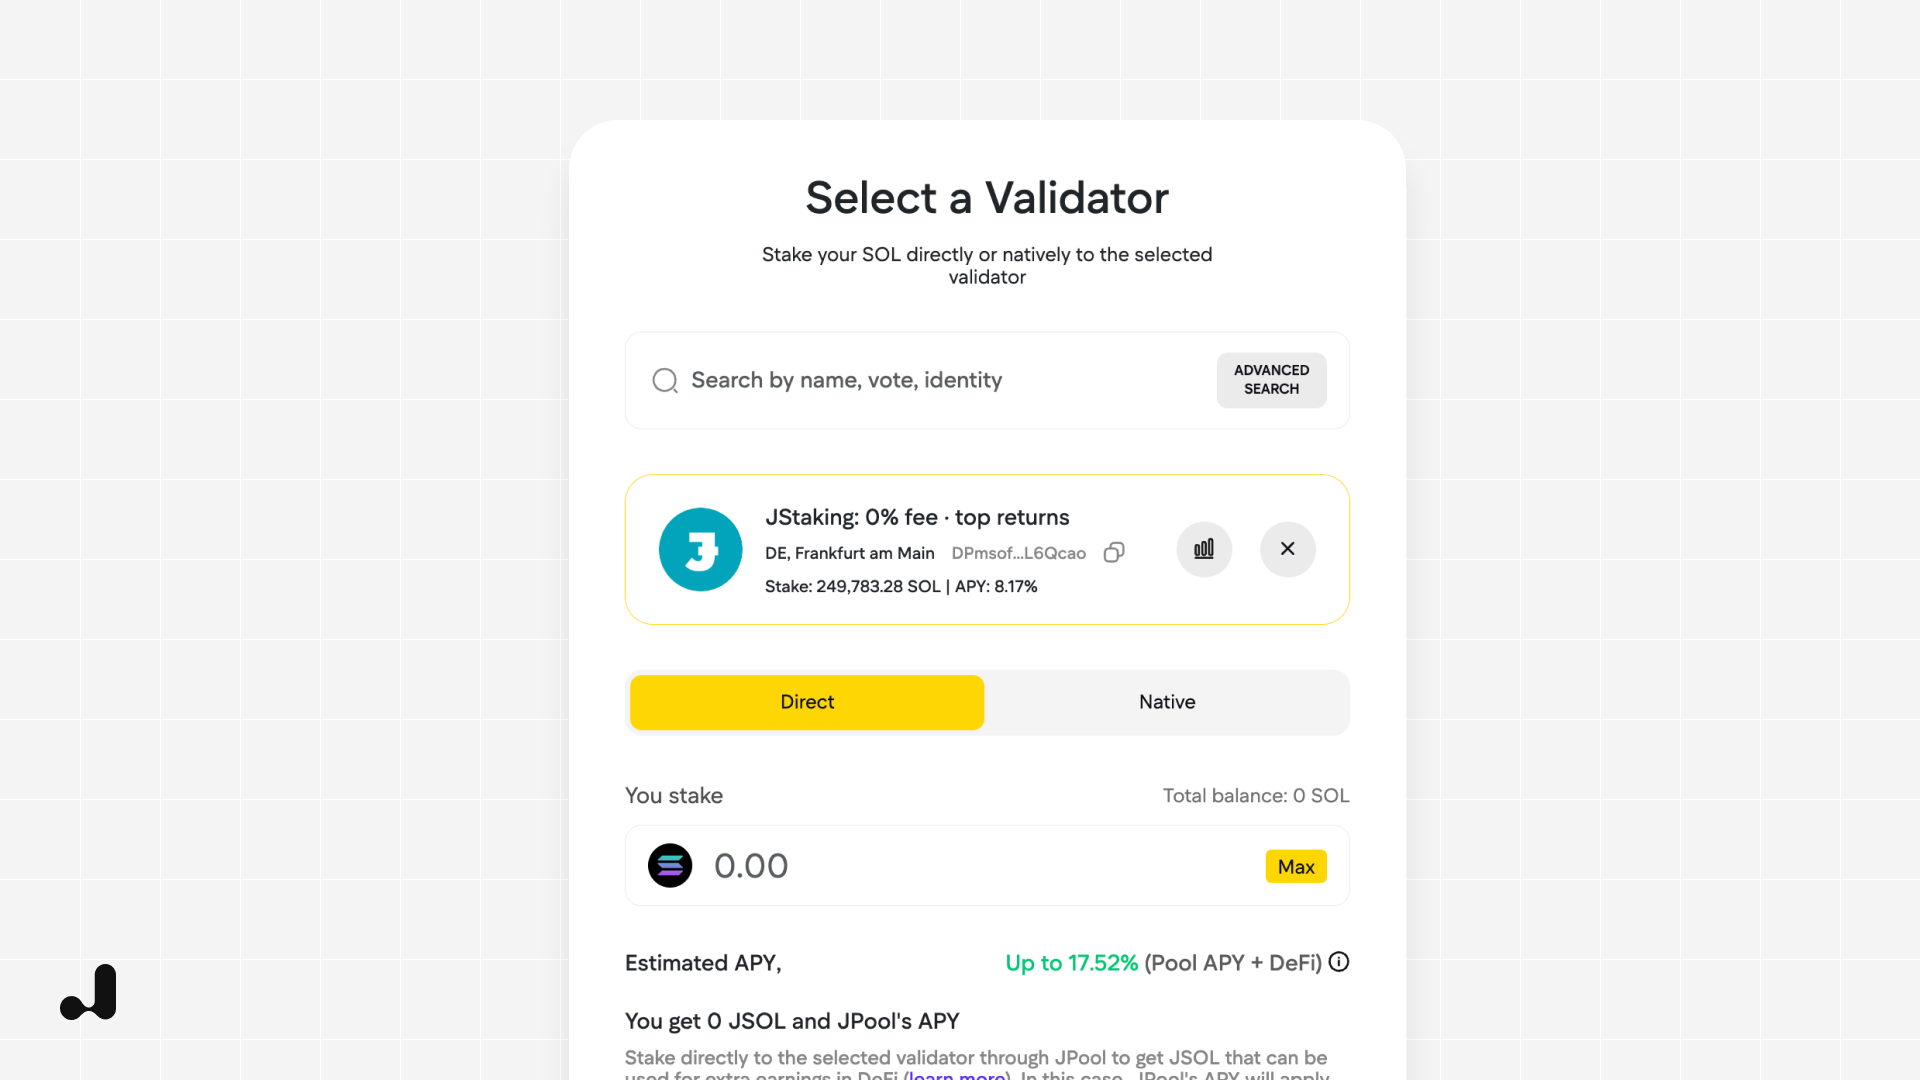
What’s New in Direct Staking?
We’ve completely reimagined the Direct Staking interface to be smarter, more intuitive, and packed with features that matter. The new design makes it easier than ever to find the best validator for your purposes — whether you’re optimizing returns, supporting decentralization, or implementing a diversified staking strategy.
Choose Direct to delegate SOL through JPool and instantly receive JSOL in return. Your SOL still sits with the validator of your choice, but JSOL gives you far more firepower:
- Always liquid: trade or deploy JSOL across DeFi without waiting for an unlock period.
- Auto-compounded rewards: JPool pools earnings and reallocates them using its Smart Strategy, so your yield grows on autopilot.
- Zero maintenance: no need to manage stake accounts or manually restake; JPool handles everything.
Prefer the old-school route? The Native option delegates SOL straight to a validator and forgoes JPool. You’ll pick up that validator’s raw APY—but:
- Your SOL are locked until you unstake.
- Rewards are not auto-compounded; you will need to manage restaking yourself.
- No liquid token means no DeFi opportunities such as lending or liquidity mining.
The Native alternative suits purists who are willing to manage their stake on their own. For almost everyone else, the liquidity, smart delegation management, and auto-compounding benefits of the Direct option make it the perfect choice.
Deep Dive: Inside the Validator Dashboard
Each validator on JPool has its own dedicated dashboard designed for both delegators and validators. It’s your control center for monitoring, comparing, and optimizing financial and operational performance. Let’s break down the dashboard’s useful features below!
1. Report – Know Your Numbers at a Glance
The Report tab turns raw on-chain data into a crystal-clear earnings statement.
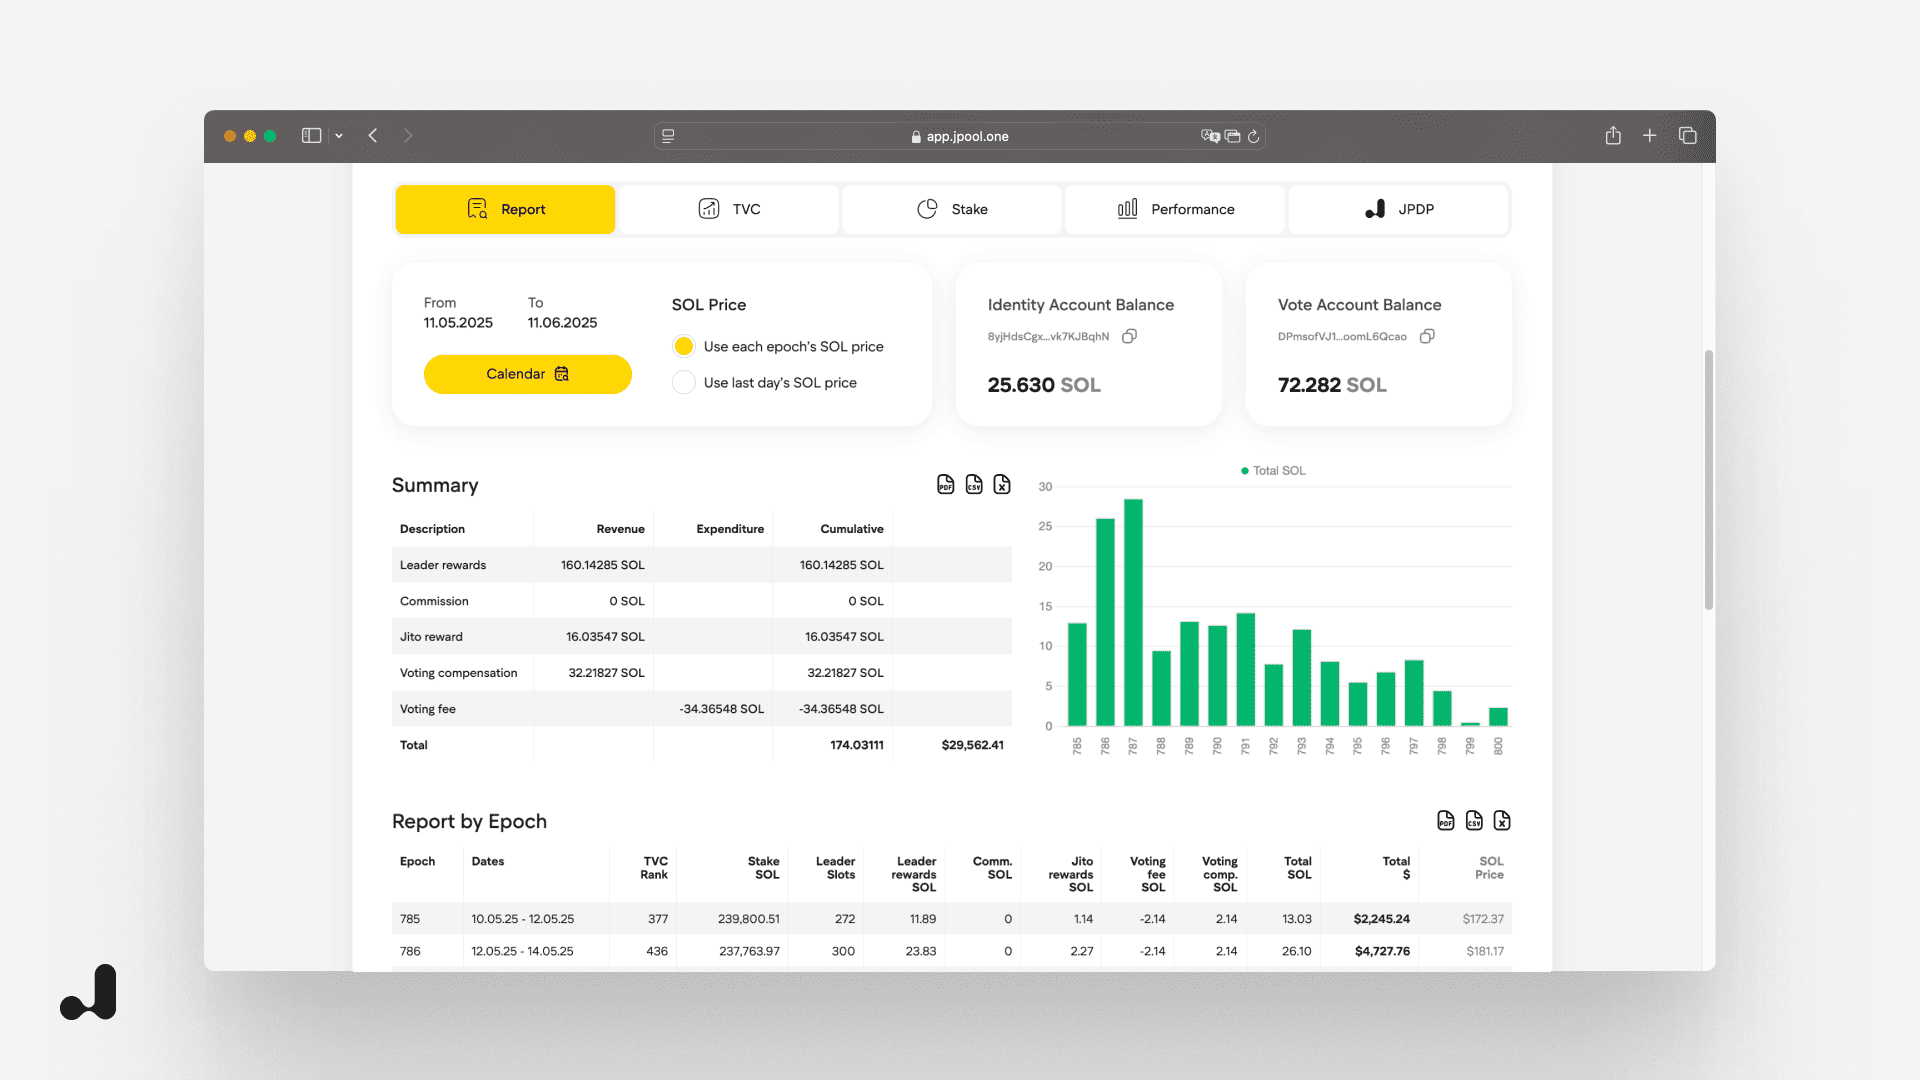
- Custom date range: Pick any period you care about—whether that’s a single epoch or an entire quarter.
- Instant financial snapshot: A summary rolls up every revenue and expense stream—Leader rewards, Jito MEV, voting compensation, fees, and more—so you can see net SOL earned (and their value in USD) in one clean row.
- Epoch-by-epoch breakdown: Dive deeper with a line-item table that logs every epoch’s stake size, rewards, fees, and TVC (timely vote credits) rank. Perfect for spotting trends or pinpointing anomalies.
- Visual earnings graph: A bar chart plots total SOL earned per epoch, making growth spurts and slow patches pop at a glance.
- One-click export: Need to share or archive the data? Download the full report in PDF, CSV, or XLS with a single click.
💡 Why it matters: From big-picture profitability to granular epoch analytics, the Report tab gives validators—and the delegators who back them—complete financial transparency.
2. TVC – Drill Down Into Timely Vote Credits
Timely Vote Credits metric measures how quickly and consistently a validator submits its votes. The TVC tab visualizes this raw performance data so you can reliably assess the quality of the node’s infrastructure without guesswork.
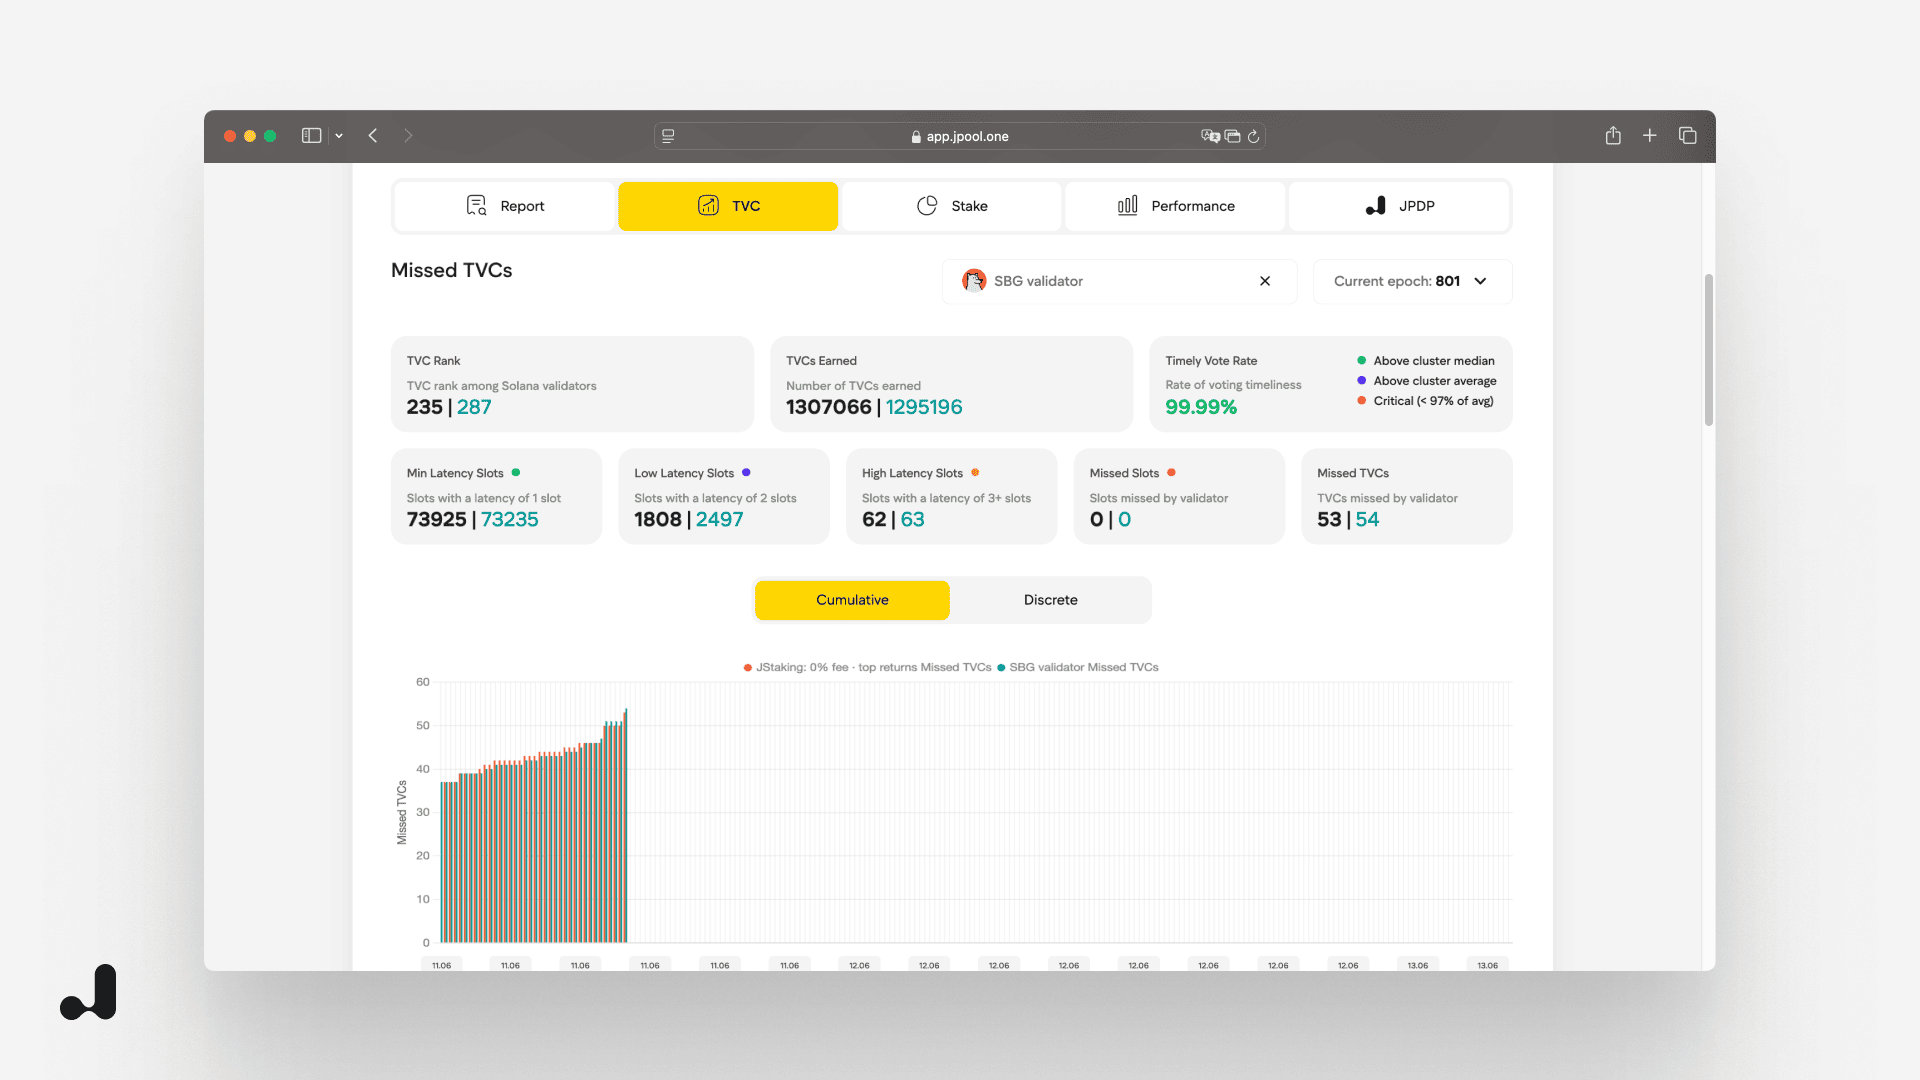
- Performance snapshot: Instantly see headline figures such as TVC Rank among all Solana validators, a color-coded Timely Vote Rate, and counts of min-, low-, and high-latency vote slots—plus any missed slots or TVCs.
- Validator comparison: Pull in a second validator and watch every metric update side by side to benchmark uptime and latency in real time.
- Missed TVC timeline: Toggle between cumulative and discrete charts that plot each missed credit by timestamp, revealing exactly when issues emerge or escalate.
- Granular vote analytics: Dive into the Vote Details table to inspect every batch—start time, slot range, average latency, and any credits or slots missed—for pinpoint debugging and performance tuning.
💡 Why it matters: The lower your missed TVCs, the better your performance score — and higher your chances of earning delegated stake.
3. Stake – See Specifically Who Holds the Tokens, and How They Move
The Stake tab turns stake movement into an open book, revealing who’s funding a validator, where that SOL is going next, and how the picture shifts epoch after epoch.
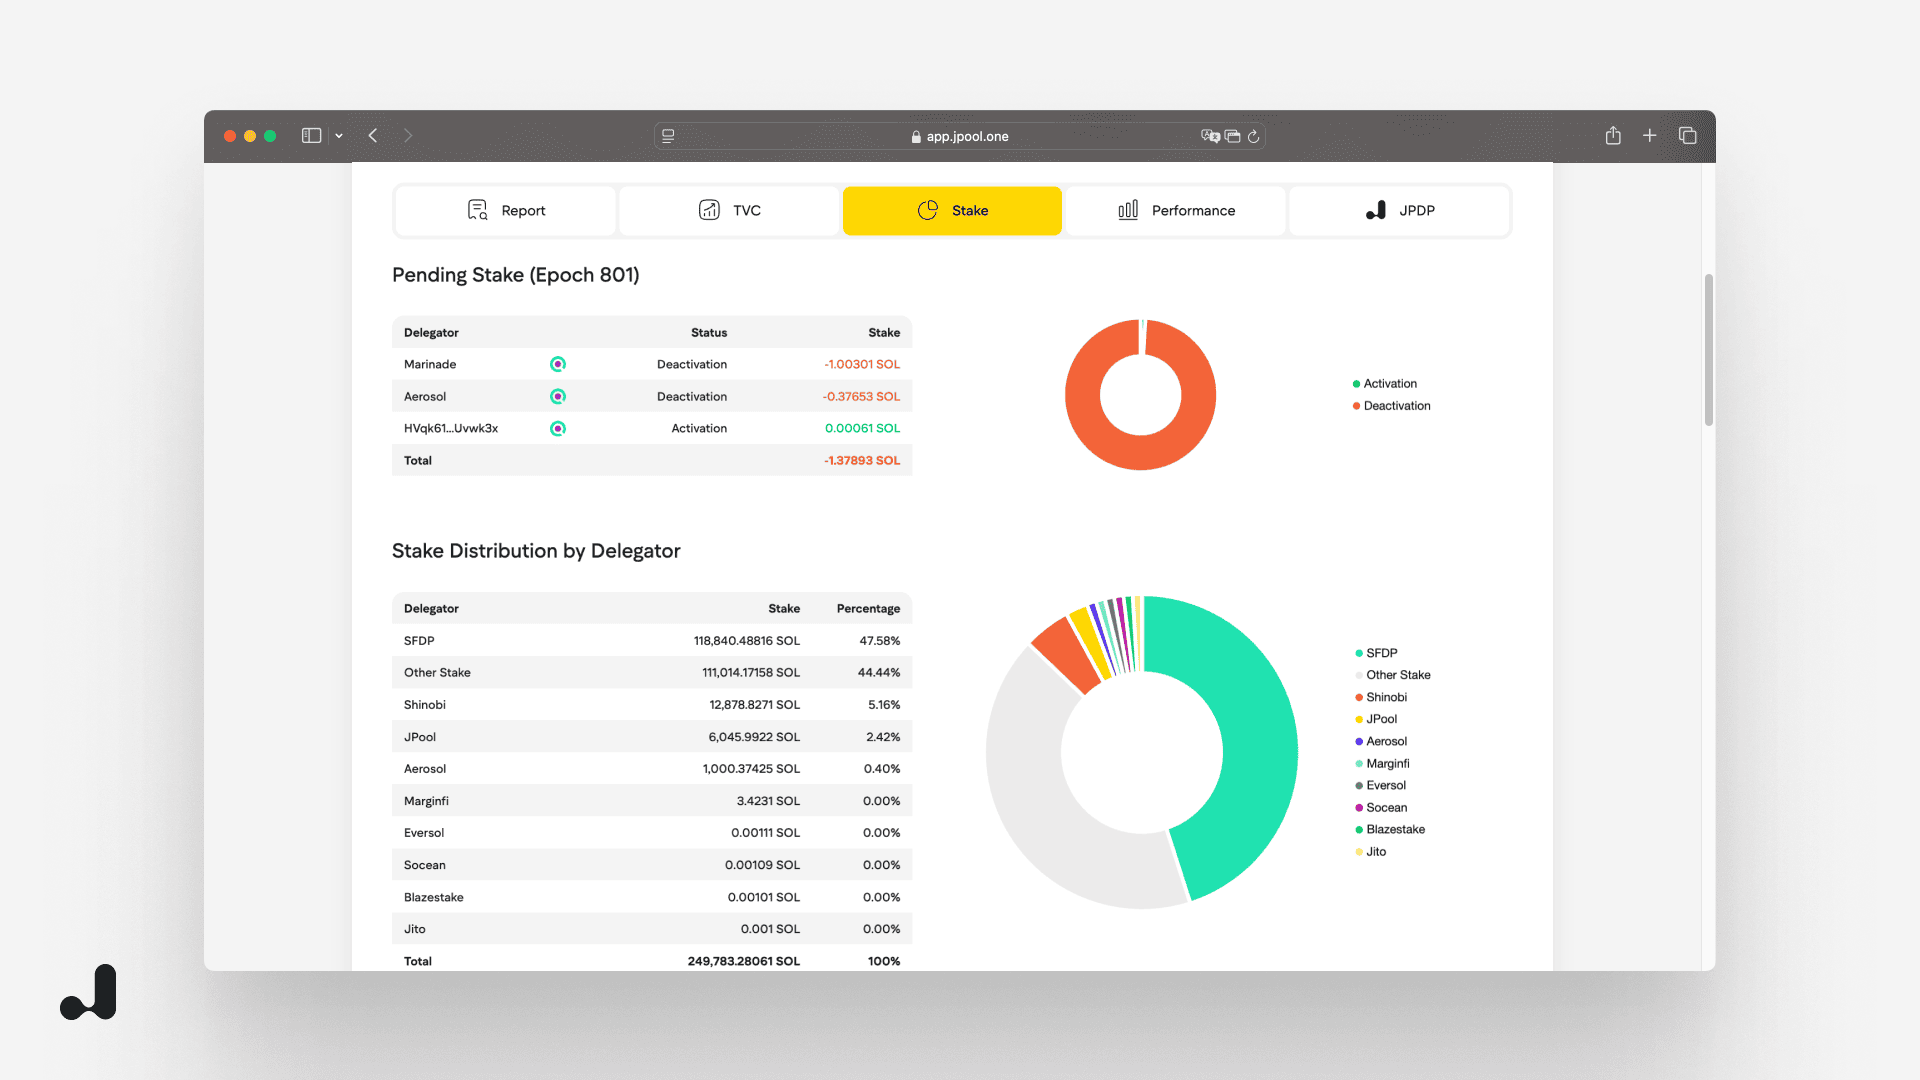
- Stake change over time: A bar chart plots total stake each epoch, making growth spurts, churn events, or long-term plateaus impossible to miss.
- Pending activations & deactivations: A live donut plus table surfaces stake scheduled to enter or exit, so you can gauge short-term inflows and outflows before they hit the ledger.
- Delegator distribution: A breakdown by delegator—liquid staking pools, DAOs, whales, or retail wallets—shows exactly who holds what percentage today, paired with a color-matched donut for instant context.
💡 Why it matters: Understanding stake dynamics lets you spot concentration risk, anticipate liquidity shocks, and market your validator more effectively to the delegator segments that matter most.
4. Performance – Measure the Metrics That Drive Rewards
The Performance tab pulls a validator’s operational stats into one dashboard, so you can gauge efficiency, reliability, and profitability in a single glance.
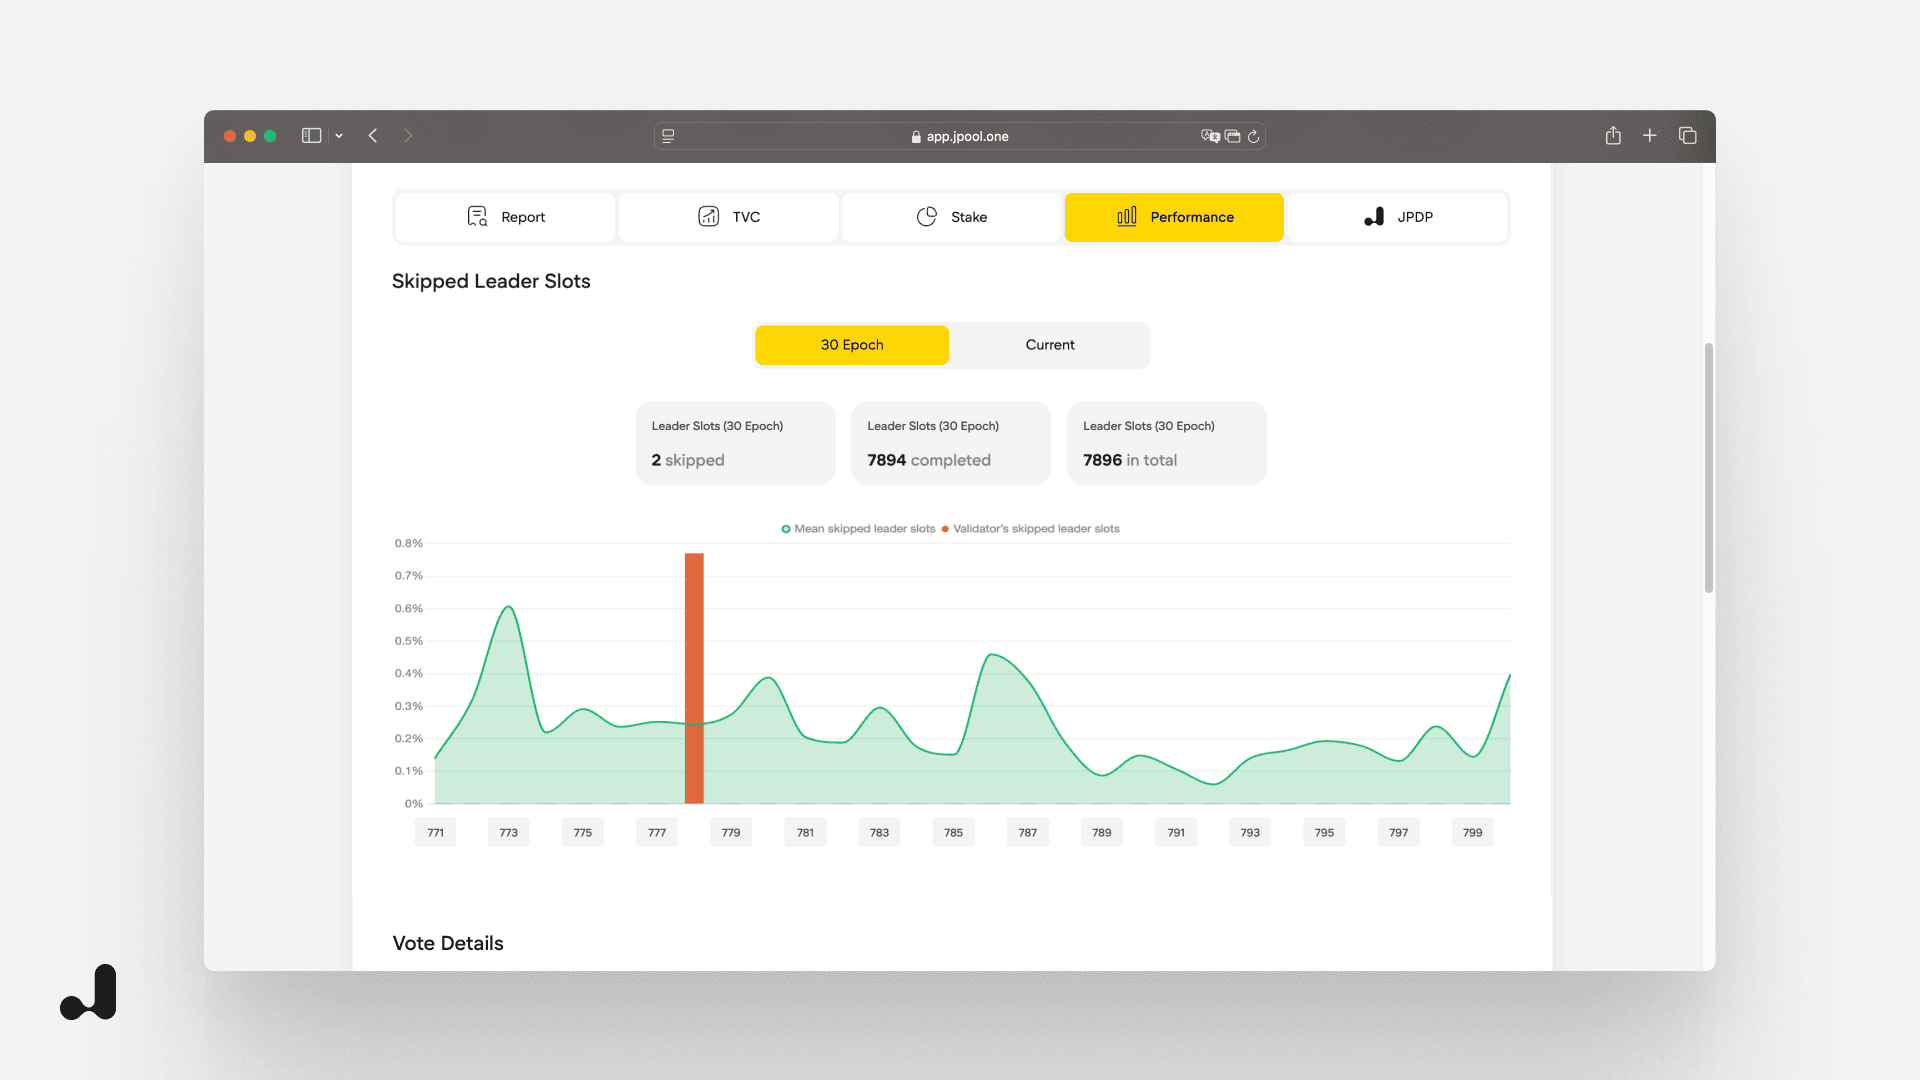
- Skipped leader slots: A dual-mode chart compares your skipped-slot rate to the cluster average across 30 epochs or the current one, making outliers jump straight off the page.
- Validator APY vs. cluster: Side-by-side bars track your epoch-by-epoch APY against the network average, revealing whether you’re adding—or eroding—delegator yield.
- Income mix (30-epoch view): A stacked line-and-bar plot breaks down total earnings into commission, leader-slot rewards, Jito rewards, voting compensation, and fees, so you know exactly what’s moving the bottom line.
- Timely Vote Credits trend: A combined bar/line graph shows your TVC count and rank per epoch, letting you cross-check voting performance, never leaving this single tab.
- Commission history: A flat or fluctuating line tracks your commission rate over time, spotlighting any tweaks that could spook (or attract) delegators.
💡 Why it matters: Delegators judge validators on uptime, yield, and consistency. With every core metric in one place, you can prove your performance, pinpoint weak spots, and showcase hard numbers that earn trust—and more stake.
5. JPDP – Track Your Standing in the JPool Delegation Program
The JPool Delegation Program (JPDP) tab shows exactly how—and why—JPool is allocating stake to your validator. Eligibility is recalculated every five epochs, so this view is your real-time scorecard for attracting, retaining, or boosting JPool delegations.
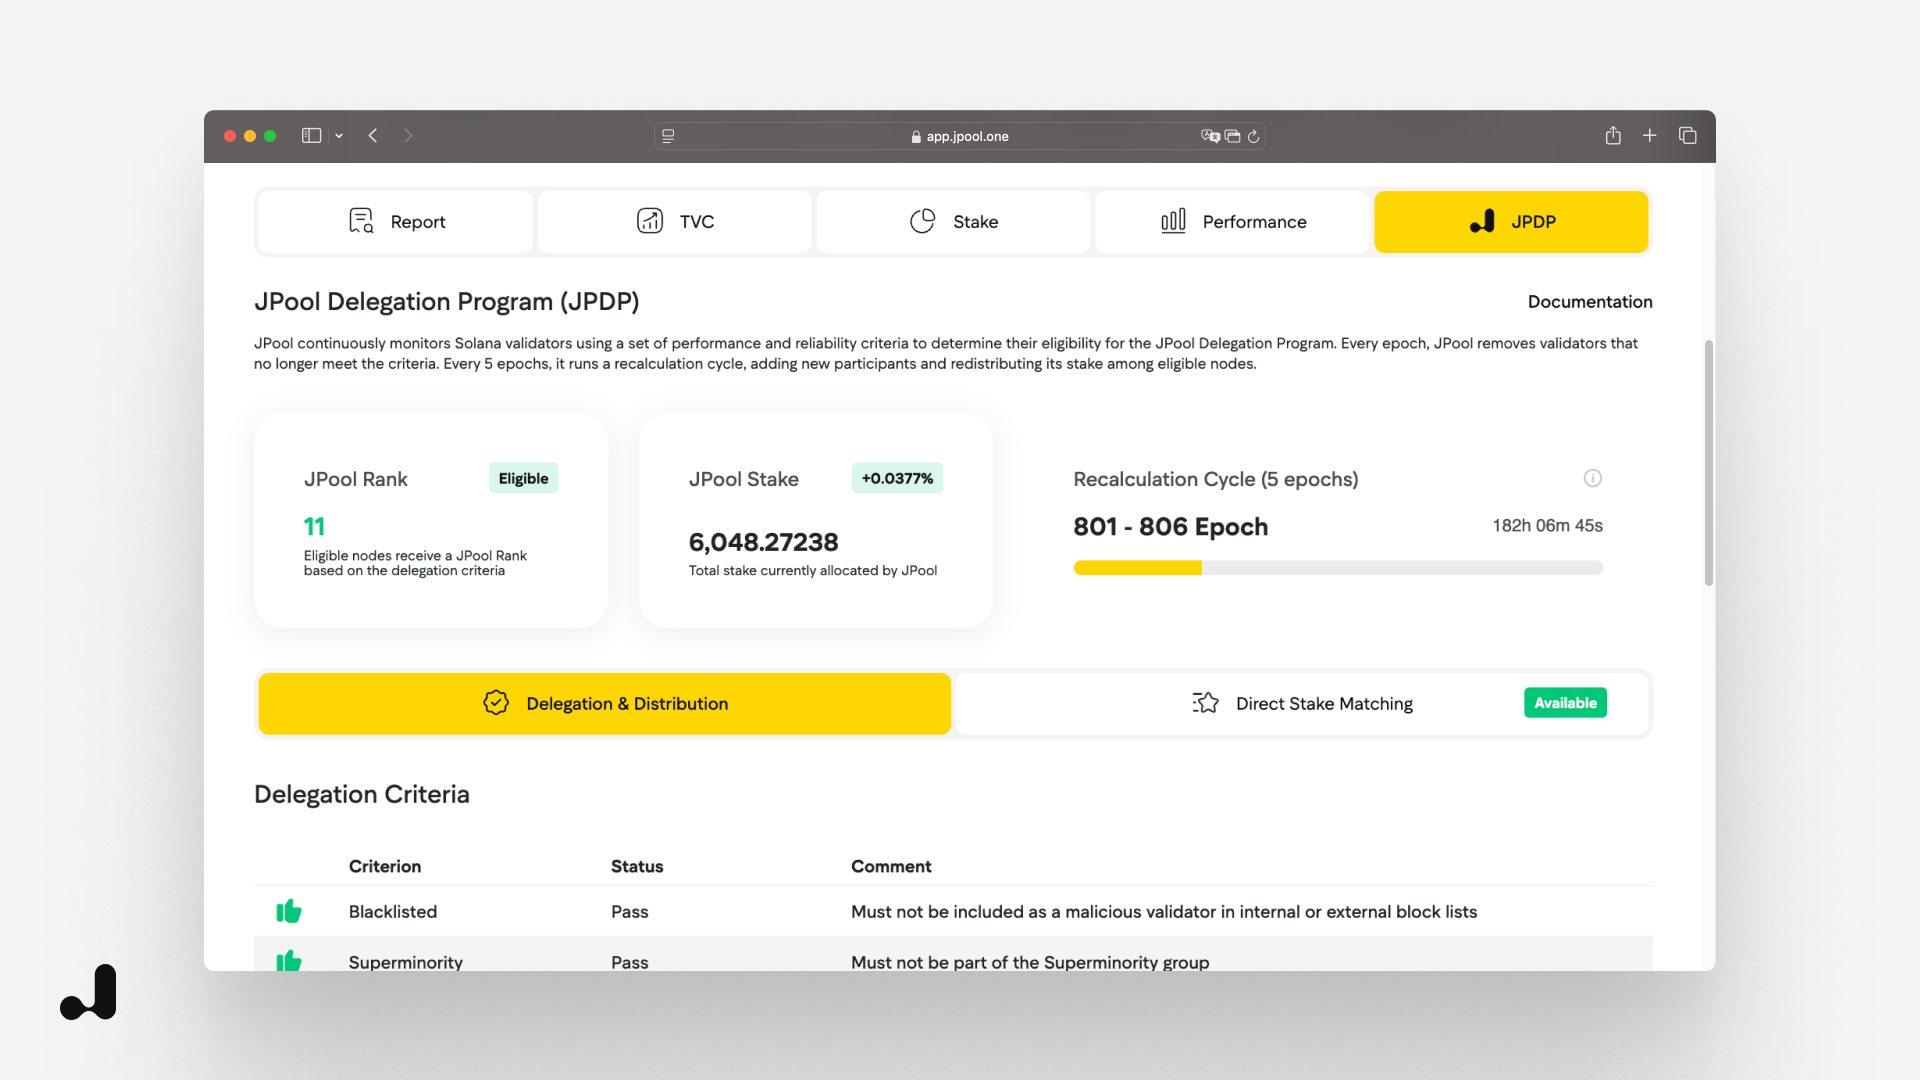
- Eligibility snapshot: Large info cards display your current JPool Rank, the amount of JPool Stake already delegated, and a live countdown to the next five-epoch recalculation cycle.
- Delegation criteria checklist: A pass/fail table walks through every requirement—from commission caps to Superminority status—so you can spot (and fix) any blockers before the next review.
- Distribution breakdown: Forecast boxes estimate the stake you’ll receive next cycle and the delta versus your current amount, while a detailed table splits that stake into buckets such as Community Good, JPool Boost, Base Delegation, and more.
- Direct Stake Matching: A dedicated pane lists wallets that have staked directly to your validator and shows the extra SOL JPool is matching—up to 20k SOL—to reward those delegations.
💡 Why it matters: JPDP stake can substantially boost your validator’s earnings and visibility. This tab tells you, in plain language, what you’re getting now, what you could get next epoch, and what concrete actions keep you in the running.
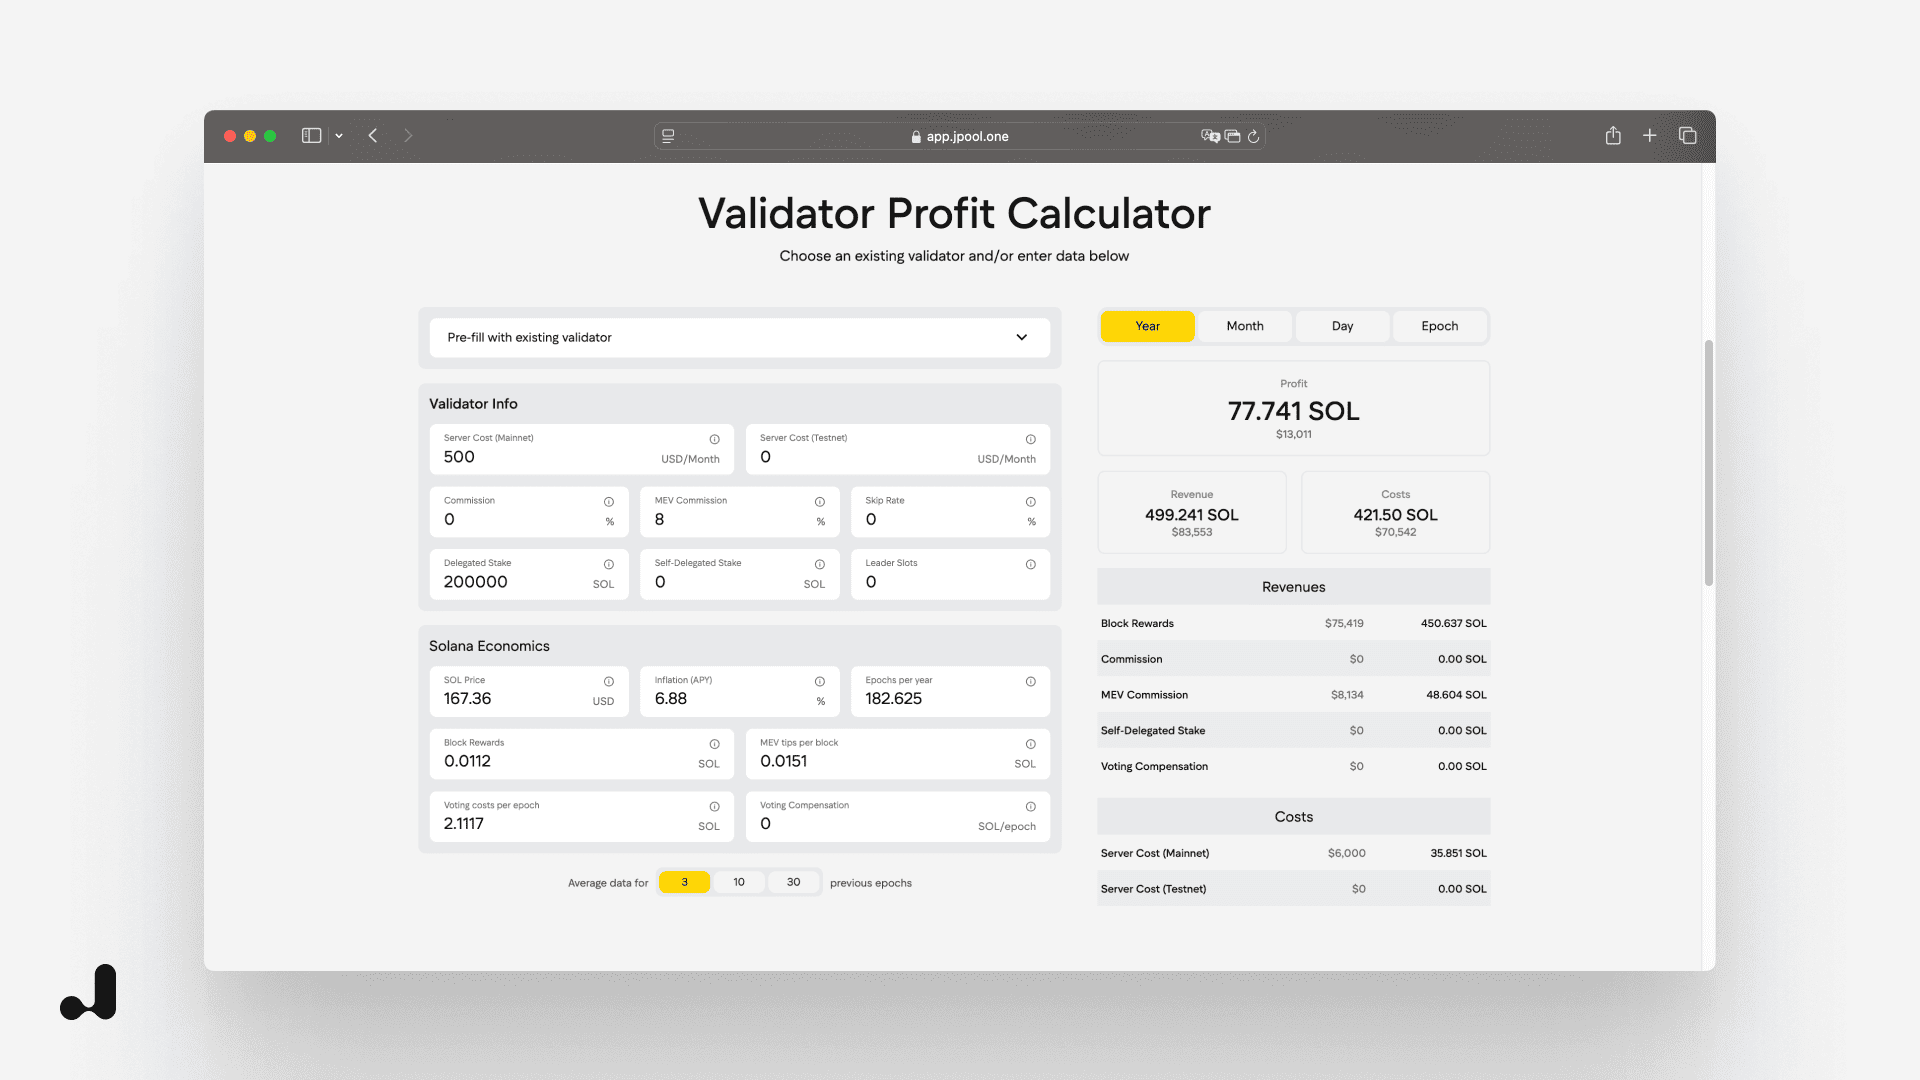
Validator Profit Calculator
With our Validator Profit Calculator, you can now easily estimate your expected returns when delegating to a specific validator. By adjusting the amount of SOL and viewing projected annual rewards, you get a clearer picture of potential profits—empowering you to compare validators not just on trust and performance, but also on projected yield.
👉 Try it now: Validator Profit Calculator
Explore. Compare. Stake Smarter.
Whether you’re a passionate supporter of decentralization or a yield-driven investor, JPool’s upgraded interface gives you everything you need to make better staking decisions — from validator reliability to network diversity and beyond.
Leave a Reply